How (and why) to set up custom fields
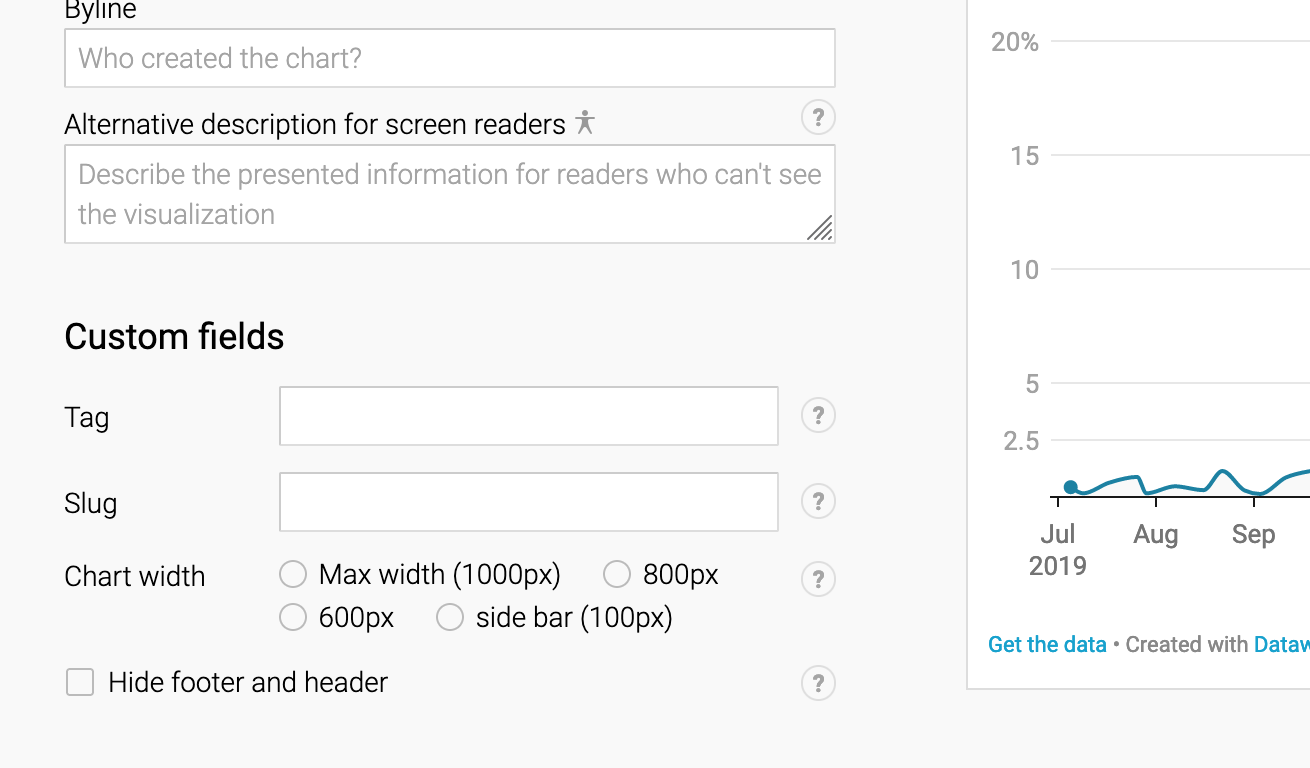 To simplify your workflow and to let you create more customized visualizations, you can add information to all your team chart, maps & tables. After you defined the custom fields in your team settings, they will appear in step 3: Visualize > Annotate, below the part where you (or your team members) give your visualization a title, description, source, byline, etc.
Custom fields are available for users on a Custom or Enterprise plan.
You can find more information about our pricing options here.
This article explains what to use custom fields for, and how to add them.
Use custom fields to improve your workflow
There are two use cases for custom fields.
The first one is to set IDs in your visualization metadata that can then read by your content management system (CMS) via the Datawrapper API. That's helpful if you want your CMS to know which visualizations belong to which articles. Your CMS could then suggest certain visualizations for certain articles and/or to certain authors.
This is how a custom field we named "slug" is displayed in Datawrapper:  And this is how the custom field will show up in the visualization metadata that you can read via the Datawrapper API:
{
   "publicId":"5ibZK",
   ...
   "metadata":{
      "data":{
         ...
      },
      "custom":{
         "slug":"productivity-is-not-as-important-as-you-might-think"
      },
      "publish":{
         ...
Examples for IDs you might want to set are:
- slug (e.g where-can-you-afford-to-buy-a-house)
- article ID (e.g. 822938)
- publication date (e.g. 2020/08/20), to just show the Datawrapper visualizations for today's articles
- name of the article author (e.g. Anna Johnson), to show the article author which visualizations they should use
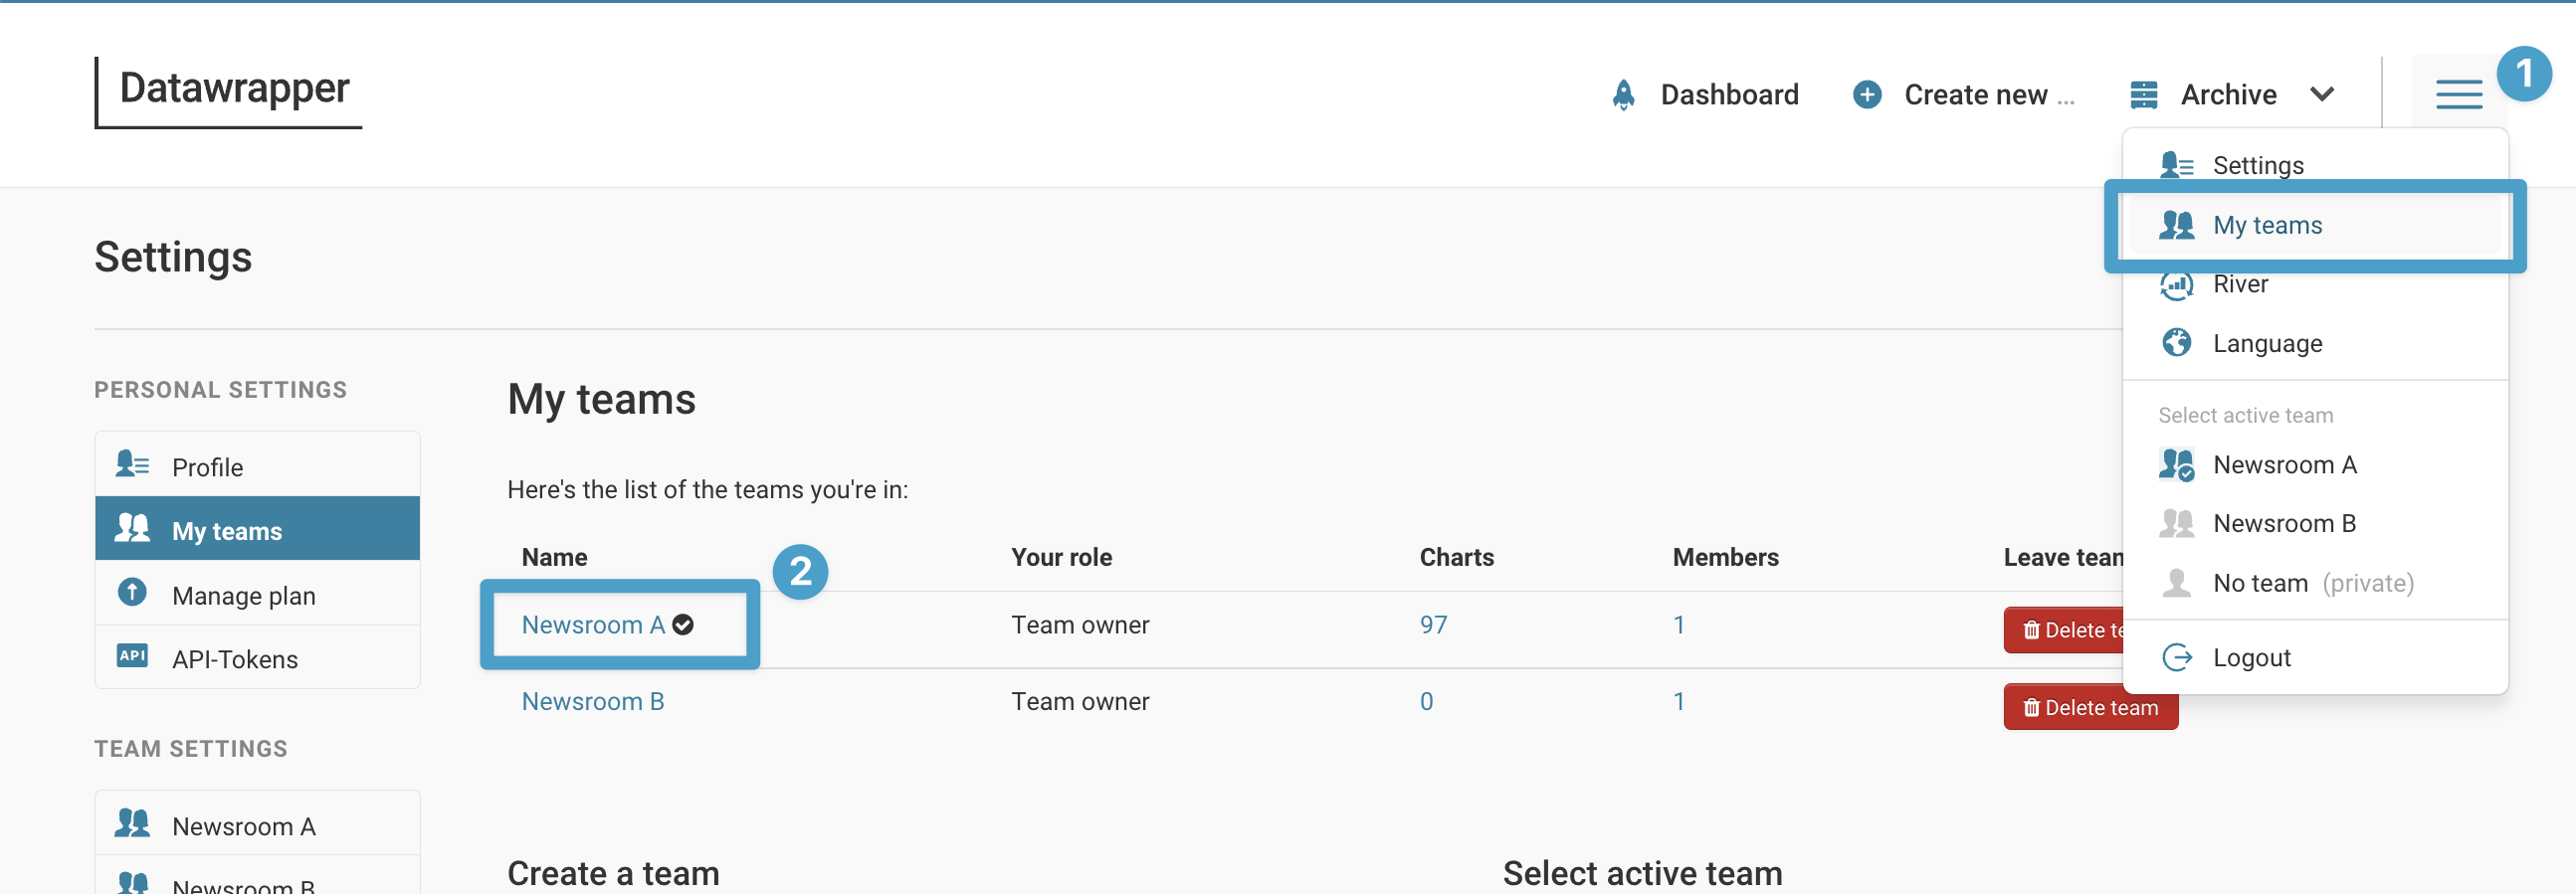
You can also display one custom field on your visualization thumbnail in Team Archive. This will allow you to quickly search for a chart in the Archive view with your specific custom field ID. You can even use a custom field to leave comments for your Team members (e.g. "✏️ Draft", "to review", "🛑 please don't touch!").

👉 For details, read How to display locale and custom field in Team Archive
There are no limits to which custom fields you can create. The beauty of custom fields is that they are highly flexible, so they work for every workflow you want to set up.
Use custom fields to customize your visualizations
The second use case for custom fields is to customize your visualizations. This will be mostly text you want to appear on the visualization, like:
- an additional title (e.g. a tag above the visualization title named "Economy")
- a figure number for PDF reports (e.g. "fig. 1.29" in the top-right corner)
- an additional link next to the source (e.g. "first published in ...")
Here's an example for a tag ("ECONOMY") that appears above the chart title:

Simply let us know how and where the text resulting from the custom fields should appear, and we will implement them as part of the custom design theme that's included in your Custom or Enterprise plan.
How to set up custom fields
Now that you know what to use custom fields for, here's how to put them in place. It's a matter of a few clicks:
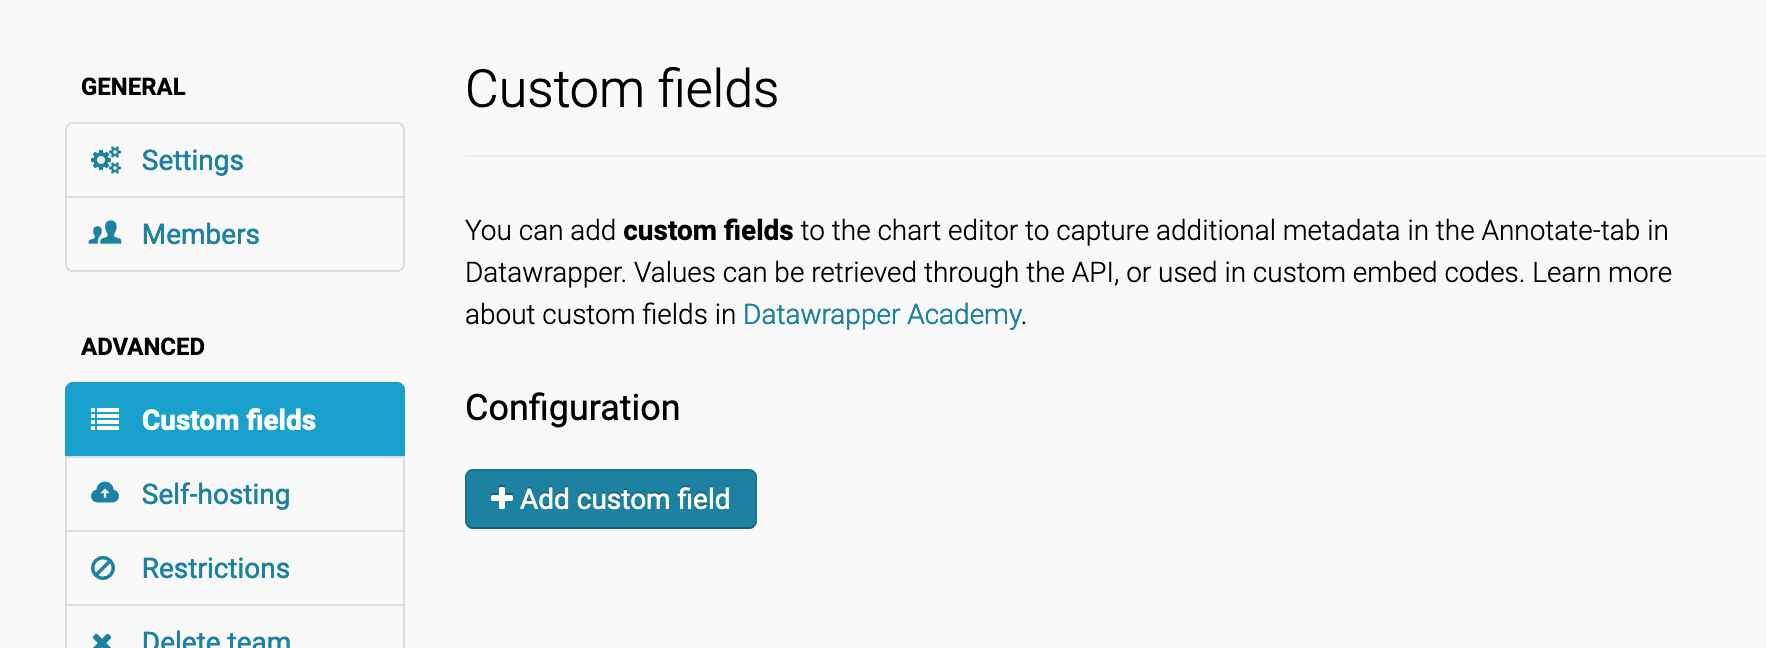
Select + Add custom field. Below the button, you can make changes to your new custom field(s). On the right, you'll see a preview of these changes.

First, choose your custom field Type.
You have four options:
- Text: For shorter text, e.g. tags, figure numbers, extra links
- Text area: For longer text, e.g. accessibility descriptions; extra notes to a chart
- Check Box: For an option that's you want to either turn on or off, e.g. "Use as article teaser", "Hide on mobile", or "Hide header & footer" (which the CMS could do by appending
?plain=1to the iframe URL). - Radio Button: For multiple options that you want to choose from, e.g. the different widths or different sections.
No matter which type you choose, you have always the option to set a Key and a Description.The Key will be used to store and retrieve your field with the API.
The Description will be displayed when hovering over the help tooltip next to your field, like so:  A special use case is radio buttons. Here you can set the available radio button options in the Options field.
If you do so, each line corresponds to one option. You can split the value and label of your radio button with the comma character by entering it as "value,label", like so: "maxwidth,The max width of 1000px".
- The value is supposed to be machine-readable. Only values will show up in the metadata.
- The label is supposed to be human-readable. If you don't define a label, the value will be used as the label.
You can add as many custom fields as you need with another click on +Add custom field.
If you're adding more than one, you can change their order by holding and dragging them up or down in the list of custom field sections: