How to create a Multiple Pies charts
A multiple pies chart is useful when you want to show proportional parts of multiple wholes and to give the reader an extra data point in the middle. The individual pies should not have too many slices as this clutters the chart and makes it hard to read. If you want to show more than five parts per pie, consider grouping them as a stacked bar chart.
Below is an example of a multiple pies chart that makes good use of the part of the whole concept. We can see the shares of three countries' wealth that the bottom 50%, the next 40% and the top 10% of citizens own:
- 1
-
Preparing and importing the data
-
If you want to create this chart type, here's what you'll need:
- One header row containing descriptive labels.
- One column containing at least two categories. This will determine the label in the pie slices. In our case, the three categories are: "bottom 50%", "next 40%" and "top 10%''
- At least one column containing numeric values. The values in the columns will define the size of the pie slices. In your final chart, one numerical column will result in one extra pie. The more numerical columns you upload, the more pies your chart will have.
The most important thing you have to keep in mind is that a pie chart always represents a whole, i.e. 100%. Therefore, you can only use data that is based on exclusive values. Making a pie chart of a survey that allows multiple answers will lead to a misleading chart. Use a bar chart instead, but never a pie chart.
That's the data we used to create the chart at the top of the page:
category Canada China Norway bottom 50% 5.6 11.0 1.1 next 40% 46.7 40.6 49.4 top 10% 47.7 48.4 49.5 -
Once you have prepared your data, import it on Datawrapper. If you are a first-time user, you can do so by going to our homepage and clicking on "Start Creating". If you already have an account, just click on ''New Chart'' in the top row on your dashboard. In Step 1: ''Upload'', you can copy & paste your dataset or upload it as a .csv or an Excel or Google Spreadsheet. After pasting the data, the textfield on the right will look like this:
-

-
Click "Proceed" at the bottom right to go to the next step:
-
- 2
-
Check & Describe
In the second step, you can check if your dataset was imported correctly and also make changes to it. These changes could include hiding certain columns from showing up in the visualization as well as the transpose function which allows you to swap rows and columns. If you did not upload a header row, you have to untick "First row as label" to avoid losing your first row of data. Always remember to do this if you don't have descriptive row and column headers.
In step 2, your data has already been arranged in columns and rows. You can see that Datawrapper correctly recognized your numbers as numbers (and not as text or dates) because they are colored in blue and are right-aligned. To learn more about the Datawrapper's automatic recognition of data formats, visit this article.

Click on "Proceed" at the bottom left to go to Step 3: Visualize:
- 3
-
Visualize
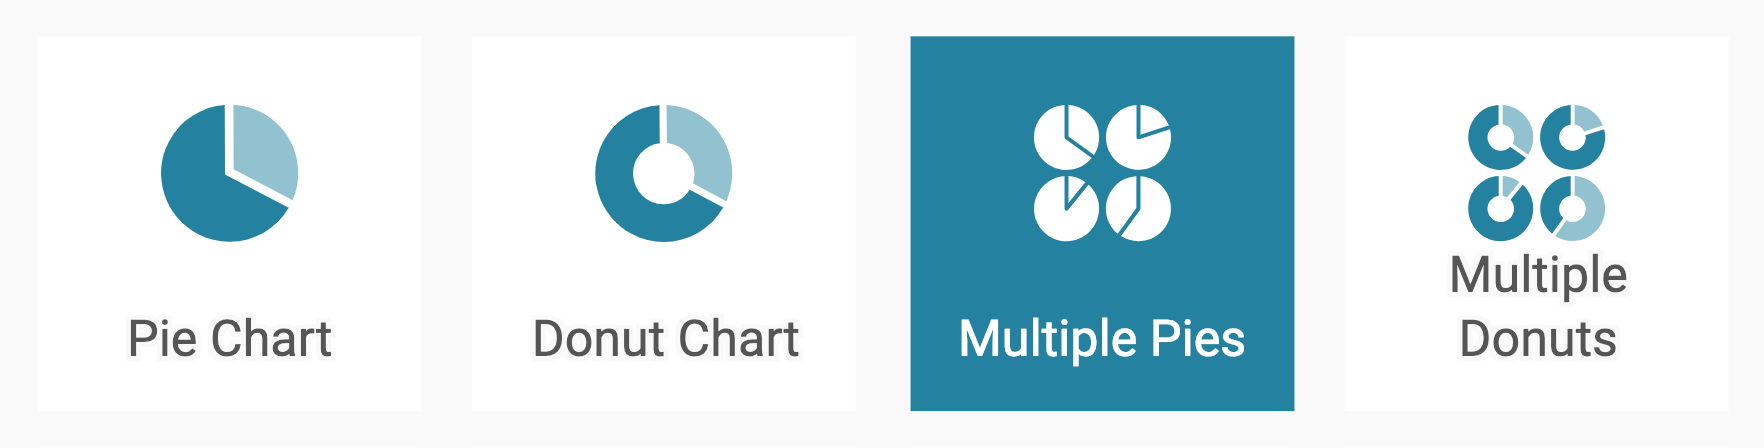
Now comes the fun part. Under the tab ''chart type'', you will see a number of chart types that you can play around with. Odds are your data will automatically be displayed as a line chart. To change that, click on the "Multiple Pies" symbol in the grid of available chart types:
-
You will now see a multiple pies chart, without a title, descriptions or customized colors. Naturally, the next step would be to further refine, annotate & define this chart. We cover this in a separate short tutorial found here .


