How to group nearby symbols
If you have too many points on your symbol map, especially in one area, the map can quickly become chaotic. Your reader will have a hard time drawing conclusions from such a packed map:
To solve this, you can group nearby symbols together to groups:
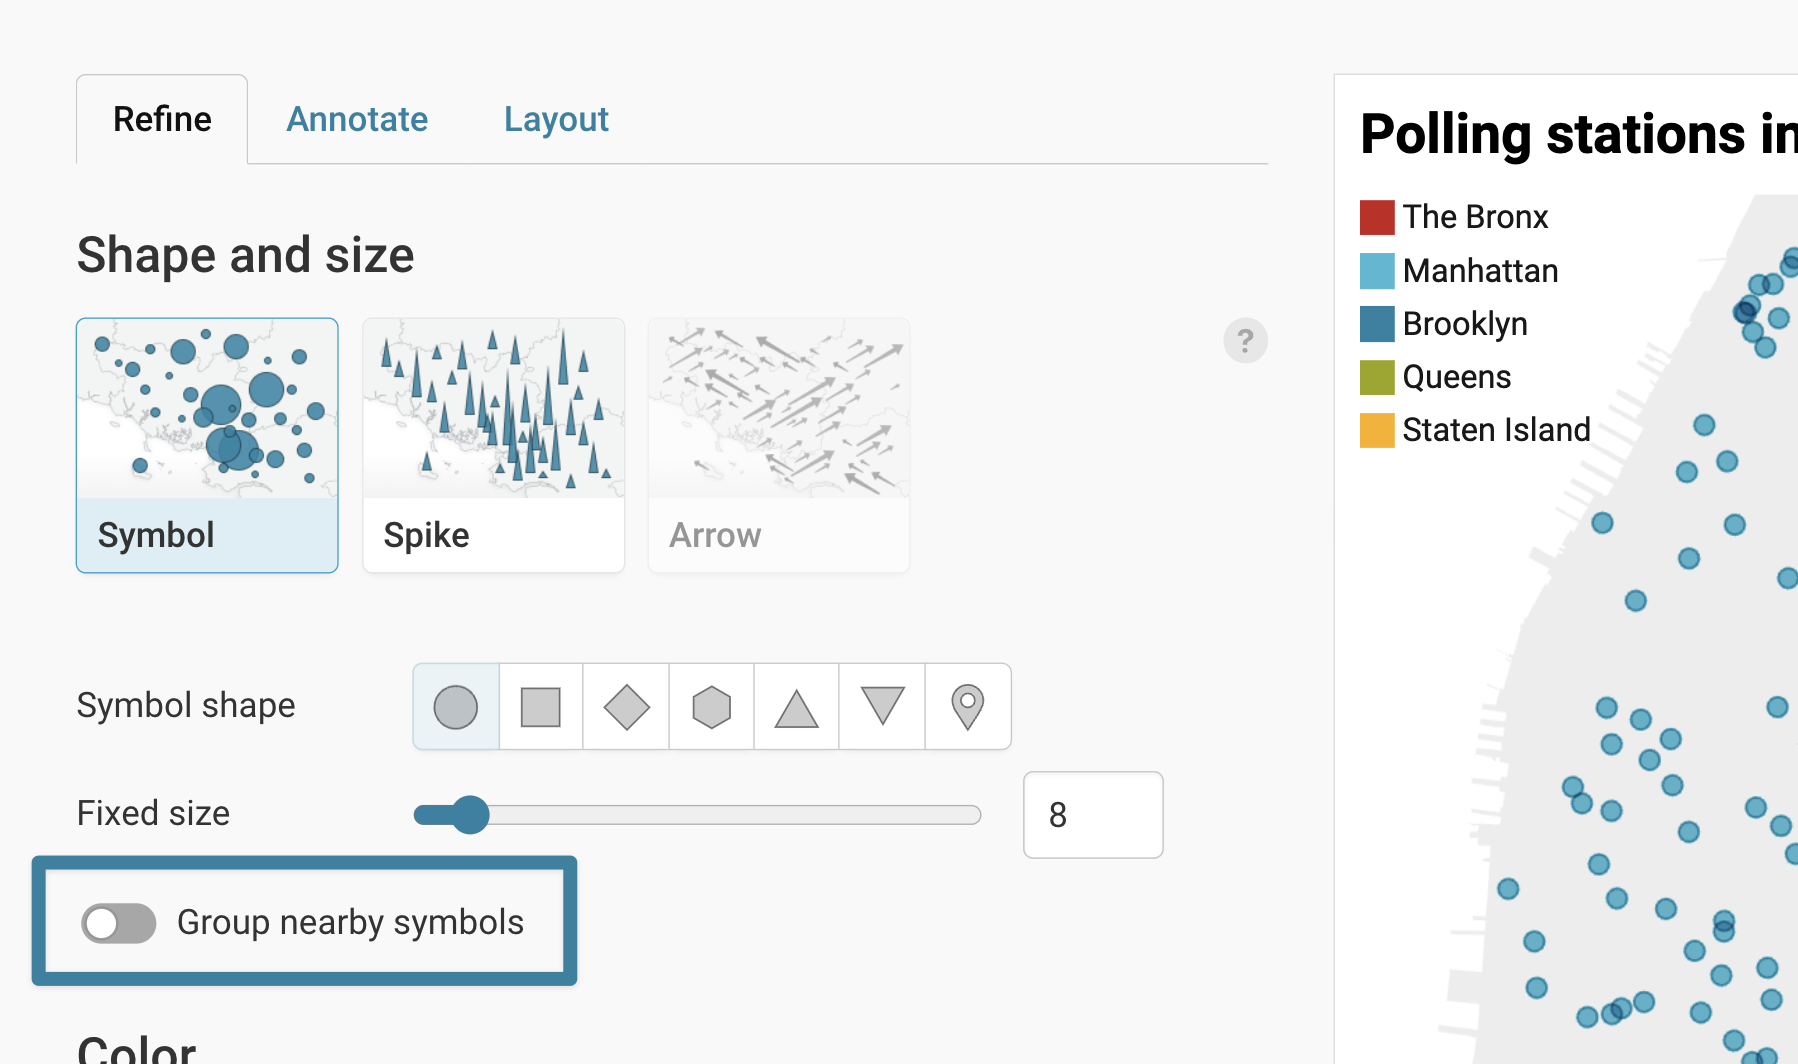
To do so, you'll need to be in the Refine tab of step 3: Visualize. In the first panel, Symbol shape and size, you'll find the option Group nearby symbols: Click on it and you'll find lots of options:

In this article, we'll go through all of them, learning how you can change the shape, size, color and position of your grouped symbols.
Change the shape and size of grouped symbols
By default, your grouped symbols will be circles. To change the symbols to squares, diamons, hexagons, triangles, or markers, change the Symbol shape at the top of the settings:
 As you can see, not all of your symbols are grouped; just the overlapping ones are. If you do want to bin all symbols, we recommend you select the hex shape (1) and then change the Grouping from group overlapping symbols to hexagonal binning (2).

To change the size of your hexagonnal binning, use the Hexbin grid size slider. Note that small heaxagons mean that the number of grouped items can't be shown anymore:
 If you're using the grouping mode group overlapping symbols, you can change the size of your grouped symbols with the Group size slider:

Change the color of grouped symbols
By default, all of your grouped symbols will have the same fixed color. You can change this color with clicking on he swatch next to Group color:
 This color is independent from the symbol color that you can set in the next panel, Symbol colors.
If you colored your symbols differently – in our case, by New York borough – and want to use that color for the grouped symbols as well, change the Color to either first symbol or most common value

Here's the difference between the two modes:
- first symbol: Below each grouped symbol is a list of symbols that are grouped together. The first symbol option uses the color of the first symbol in this list. You can find out which symbol is first in this list with the help of grouped symbol tooltips. To learn more about them, visit our Academy article "How to create tooltips for grouped symbols".
- most common: This option uses the color of the most common symbols in this group. For example, if you group 5 Manhattan symbols and 2 Queens symbols together, the grouped symbol will take the color of the Manhattan symbol.
Change the position of grouped symbols with Iterations and Tolerance
If you're using the grouping group overlapping symbols, you see two more options for grouped symbols: Iterations and Tolerance.
- Iterations: This setting (with a range between 1-9) controls how often the algorithm performs its grouping on the available symbols. The more often the iterations, the fewer the chances would be that grouped symbols located very close to each other overlap:

- Tolerance: This setting (with a range between -1 to 0.5) controls how much space is added between grouped symbols.
- The more positive the value, the moreindividual symbols will appear on the map instead of being swallowed by the groups.
- The more negative the value, the more space will appear between the grouped symbols.


Iteration and tolerance are strongly dependent on each other. You will see that the tolerance feature behaves differently when the iteration feature is set differently, and the other way round.
Don't worry if you customized your tooltips and then change the size of the grouped symbols: The tooltips will adjust accordingly. There's no need to worry about whether you might lose some information about a particular symbol.
And that's it! Before publishing, make sure to check how your map looks like in mobile and tablet view, to make sure the grouped symbols appear as you want them to for all your readers.