How to create a live-updating visualization with JSON data
In this tutorial, you'll learn how to create live-updating charts with JSON data using Google Apps Script. (Don't worry, you don't have to know Google Apps Script. But you do need to use Google Sheets.)

- 1
-
👉 Click here to create a copy of our pre-prepared Google sheet & scripts. When shown the following screen, click Make a copy.

- 2
-
You'll notice that the Google sheet has two sheets, an empty Sheet1 and a sheet called Sources. The sheet called Sources is where you can insert the URL(s) to the JSON data that you want to import.

We have pre-filled it with one example — the Alpha Vantage demo endpoint mentioned above. You can directly replace that URL with your own, or test the import using the provided example.
The second column in the Sources sheet specifies which sheet the data should get imported into. If no sheet name is provided, or the sheet does not exist, one will be created when the import runs.
- 3
-
You'll also notice a button that says Load Data. Clicking on it will run the script that imports the data. Note that any content in the target sheet(s) will be automatically removed before being replaced with the newly imported data.
The first time you click the button to run the script, you will need to give the script permission in order for it to be able to write to your sheet. Once you have done that, you'll need to click it a second time, to actually run the script.

- 4
-
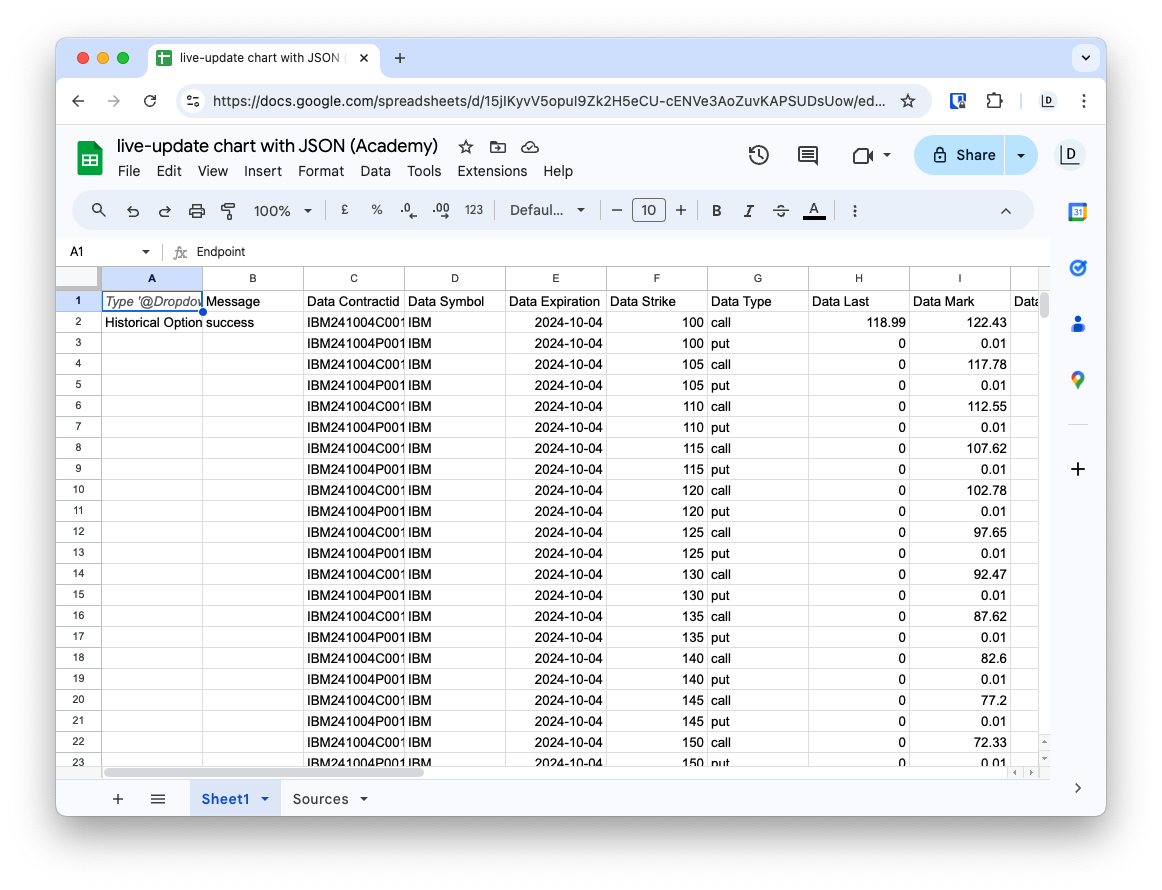
Once the script has finished running through, you should see the data has appeared in the specified sheet ( Sheet1, in our example setup):
- 5
-
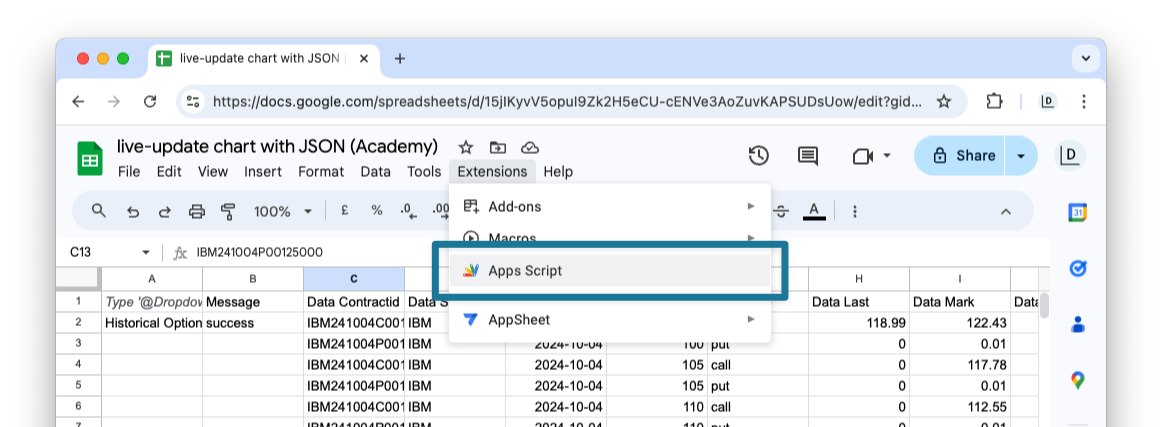
Now you need to set up the script to run automatically at regular time intervals. To do so, first open the script editor by going to Extensions > Apps Script.
- 6
-
This will open the script editor, where you will also find the settings to configure the script to run automatically.
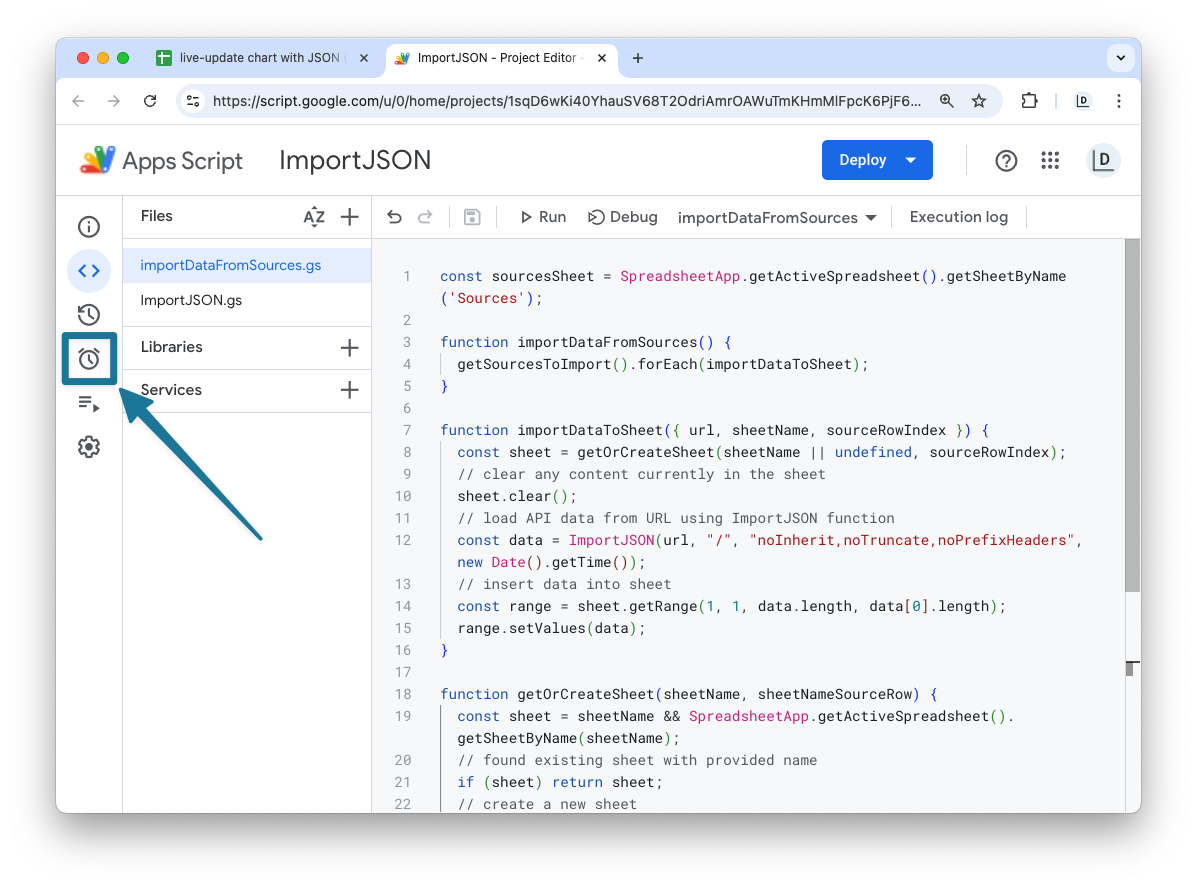
Note — here you can see the two scripts responsible for the import. ImportJSON, which takes care of loading JSON data into a tabular format that can be inserted into a sheet, and importDataFromSources, which runs ImportJSON on each of the sources specified in the Sources sheet, and inserts the loaded data.
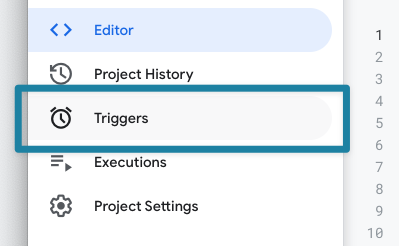
Next, click the timer icon on the left and click Triggers:
- 7
-
On the bottom right, click on Add Trigger:

- 8
-
Select importDataFromSources as the function to run and choose the event source as Time-driven:

- 9
-
You can then choose how often you want it to run. Here, we've selected the update to run every hour. Once you've selected, click Save:
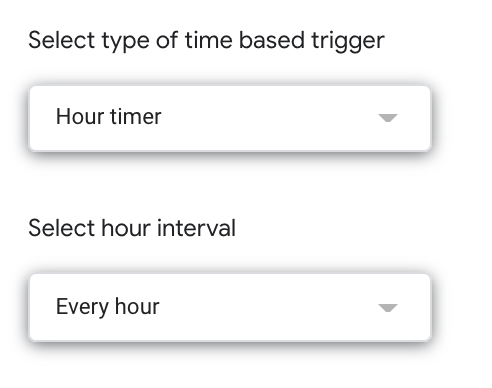
- 10
-
That's it! Your sheet is ready. You can now go back to your Google Sheet and turn on sharing by clicking the "Share" button on the top-right corner:

Make sure that your Google Sheet is set so that Anyone with the link can view. Click on Copy link.

Now you can paste that link into step 1: Upload Data in Datawrapper after selecting Link external dataset configuration. If you're not familiar with what this is, check out our Academy article Automatic chart updates: How to publish charts with external data sources.


If you have any questions, reach out to us at support@datawrapper.de.