How to get data from Google Trends for charts or maps
In Google Trends, Google compiles and aggregates its search data, reflecting the interest in certain keywords or concepts.
While search data is not the same as a poll or survey, these comparisons can provide insights, specifically for very recent developments. Surveys take time, often we get updated statistics only a few months or even a year later. So, the core offering of Google Trends is that it enables you to look up keywords and compare their popularity, over time and per country.
This brief tutorial shows you how to look up Google Trends, export the data and create either a Datawrapper chart or a map.
How to download data from Google Trends
To visit Google Trends, go to https://trends.google.com
In the search field, you can enter one or more search terms (separate terms with a comma).
Example
As an example, we are going to work with a comparison of searches for some buzzwords. So in the search field, we will type: Bitcoin, Ripple, Ethereum, Blockchain The first three words are names of crypto-currencies, the last word describes the concept behind them. All four phrases have been discussed a lot in the past few years, but let's understand how much.
When we press Enter, we'll get to a page with the results. At the top, we can add search terms or rewrite them. Especially helpful are the filters below the search terms. We can decide for which country and over which time range we want to see the results:  This is the chart that we'll see for these settings:

Source: Google Trends
Note that Google aggregates the search data for "interest over time". They do not provide the absolute number of searches, but an aggregation. Here is what the Google Tooltip says about the structure of the data
"Numbers represent search interest relative to the highest point on the chart for the given region and time. A value of 100 is the peak popularity for the term. A value of 50 means that the term is half as popular. A score of 0 means that there was not enough data for this term." Source: Google Trend
The following part of this tutorial will explain how we can export the data from Google Trends into Datawrapper:
1. Download the data
To create a Datawrapper chart with this data, we first need to get the data: Click on the downfacing arrow in the upper right of the chart:
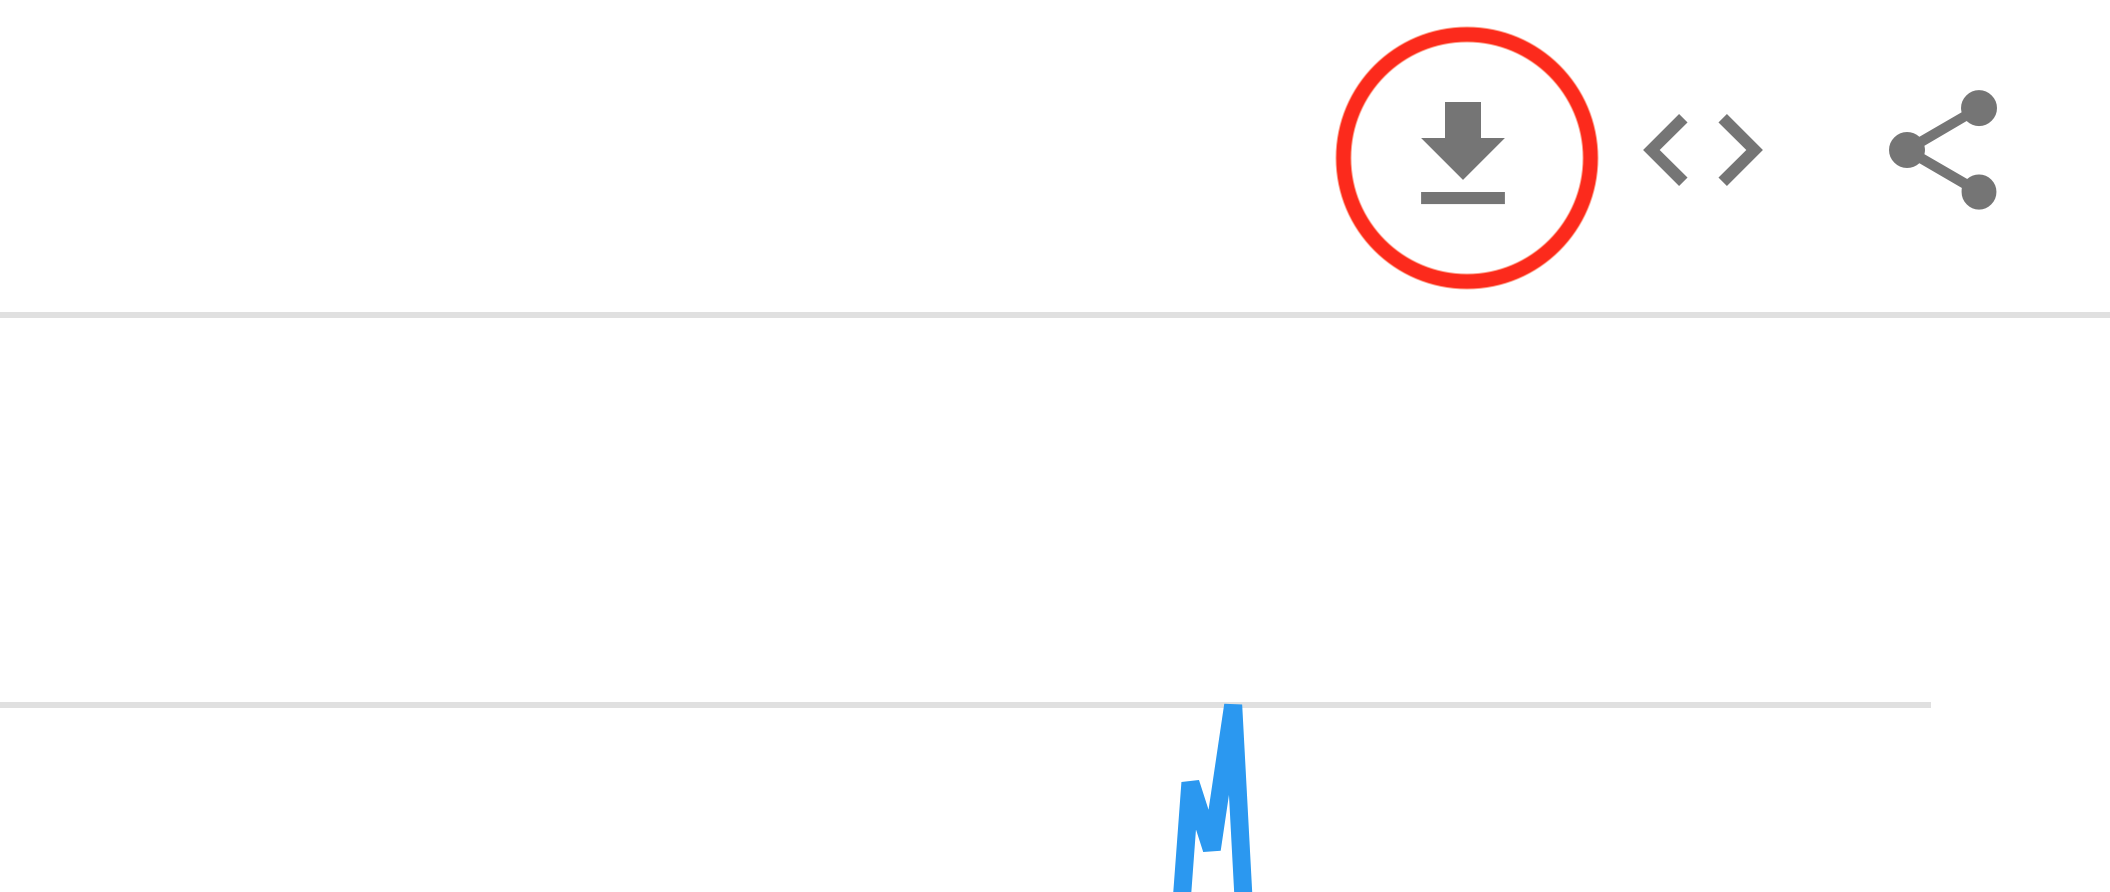
This will download the data to your computer in the .csv format (= "comma-separated values"), a common, simplified data exchange format which is understood by any spreadsheet software.
2. Search for the data on your computer
Your browser (Chrome, Firefox, Safari etc.) downloaded the data for you, now you need to find it! I might be in your "Downloads" folder or on your desktop. Maybe you defined a special folder for downloads; then you'll find this setting in your browser settings.
3. Clean/check the data in a spreadsheet
Although Datawrapper accepts .csv's, we still need to clean up the data a bit before uploading it to Datawrapper. So we are taking a side-step and upload the .csv first to a Google Sheet (Excel would work too). Here is a link to this spreadsheet.
 Here are the steps we can do to prepare the data:
- delete the first two rows, so that our data headers are in the first row
Select the two first rows, then right-click on the index number column to find the "Delete" command - shorten the headers, e.g. "Bitcoin" instead of "bitcoin: (Worldwide)"
Do this by hand or use "find & replace" - "<1" won't be recognized as a number by Datawrapper, so we want to find & replace it with "0"
Use Command/Strg+F to open the search, then click on the button with the three dots to get to the "find & replace" window.
Here's a GIF of all three steps:

4. Upload to Datawrapper
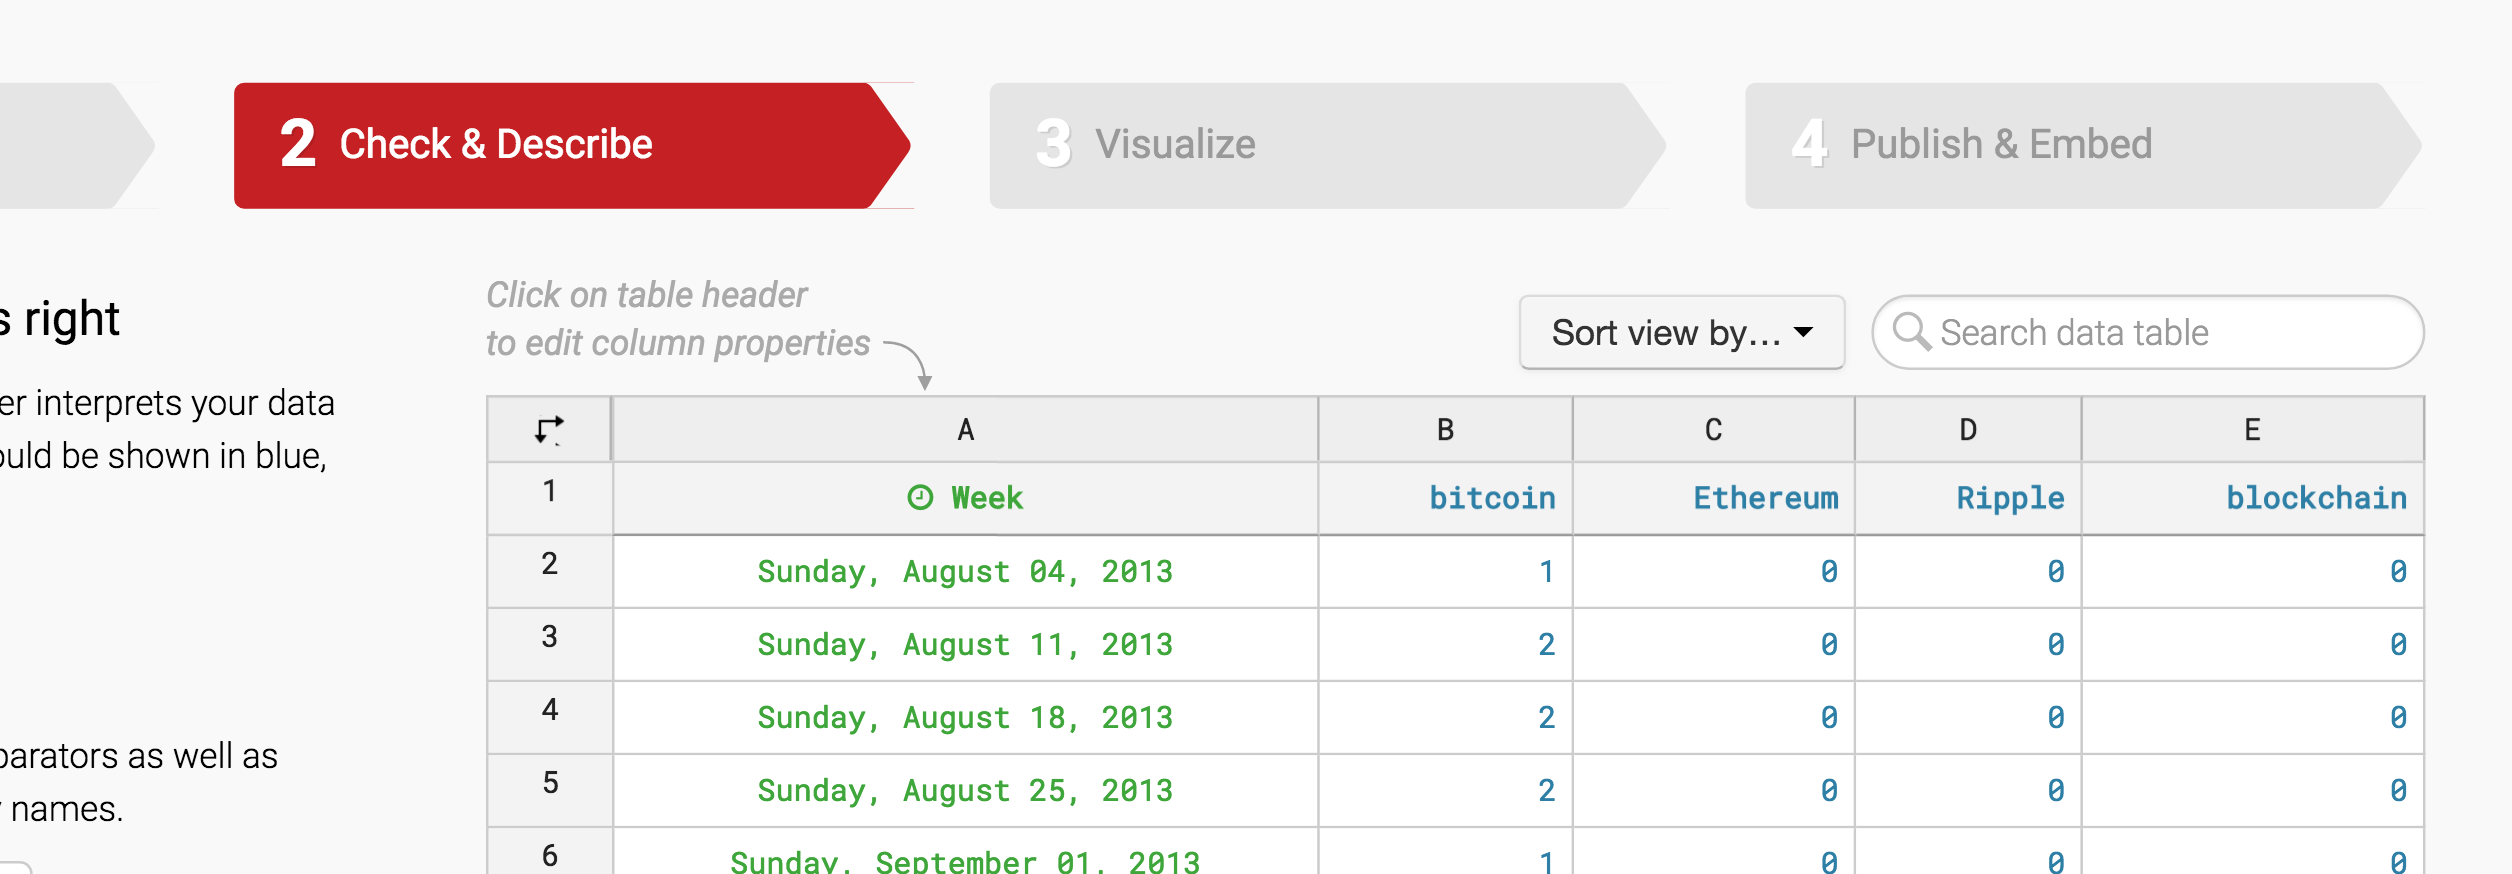
Now that we cleaned up our data, we can take it to Datawrapper. Simply copy the data and paste it into step 1: Upload Data of the chart creation pipeline. We can go to step 2: Check & Describe to see that the data is recognized correctly. Our dates are interpreted as dates (green and center-aligned) and our numbers are recognized as numeric (blue & right-aligned):
5. Create a line chart
For our final chart, we hide the title and use text annotations instead. We also made use of the "highlight range" feature to highlight the time range between November 2017 and February 2018. For more information on how to customize line charts, visit this article. Note that the information about what data is added to the notes field under the chart. Same for the source and a link to the source.
6. Other options to work with Google Trends data
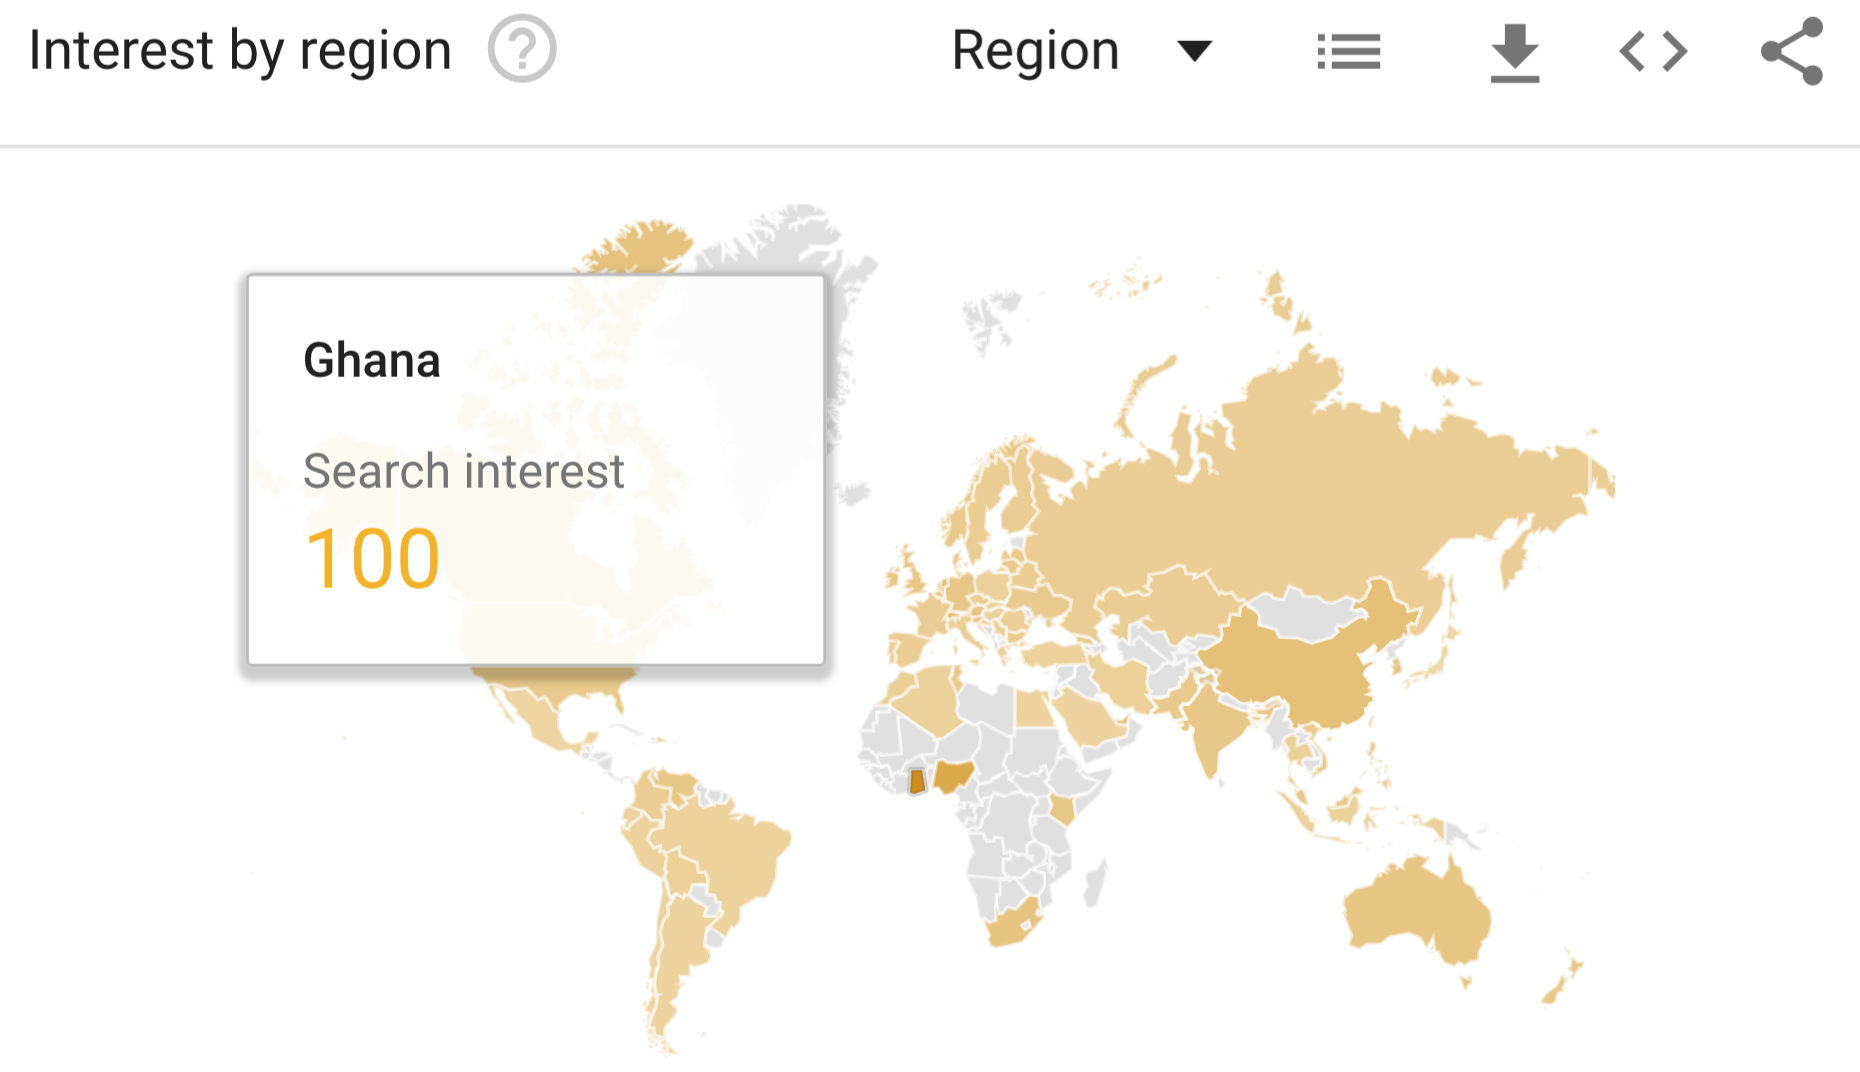
The Google Trends data has more facets than just interest over time. For example, you can look up in which countries interest in certain words or concepts is stronger or weaker.

And you can compare search interest for just one topic per country, too. For example, interest in Bitcoin is specifically strong in Ghana – it would need more research to determine why this is the case.
You can download this data, too, to create maps with Datawrapper.
Create your own search data comparison with Google Trends
Did you know that you can create your very own Google Trends analysis on basically every word? Simply add words to a custom chart to get the data. To add another word click on the "+"-sign to the right. What would be concepts of interest to you or your audience?

Why and when to use this source
If you are now asking why one should download and then upload data which is in a chart and then create another chart, here's why: Firstly, Datawrapper charts have some features such as annotation which can enhance the story. Secondly, if you have a Custom or an Enterprise plan, a custom layout will show the data based on your style guide, with your logo – not just as a copy or embed of a Google Trends chart.
While both approaches are possible (embed or reproduction) we think that in the long run publications should put their own brand first to gain trust. Finally, imagine that you do a story about either Bitcoin and Blockchain and use other sources beyond Google Trends: This would result in a rough collection of charts in different styles.