How to combine line and bar charts in Datawrapper
👉 This tutorial assumes you already know a little bit about creating line charts in Datawrapper. If not, we suggest you read the following articles first: "
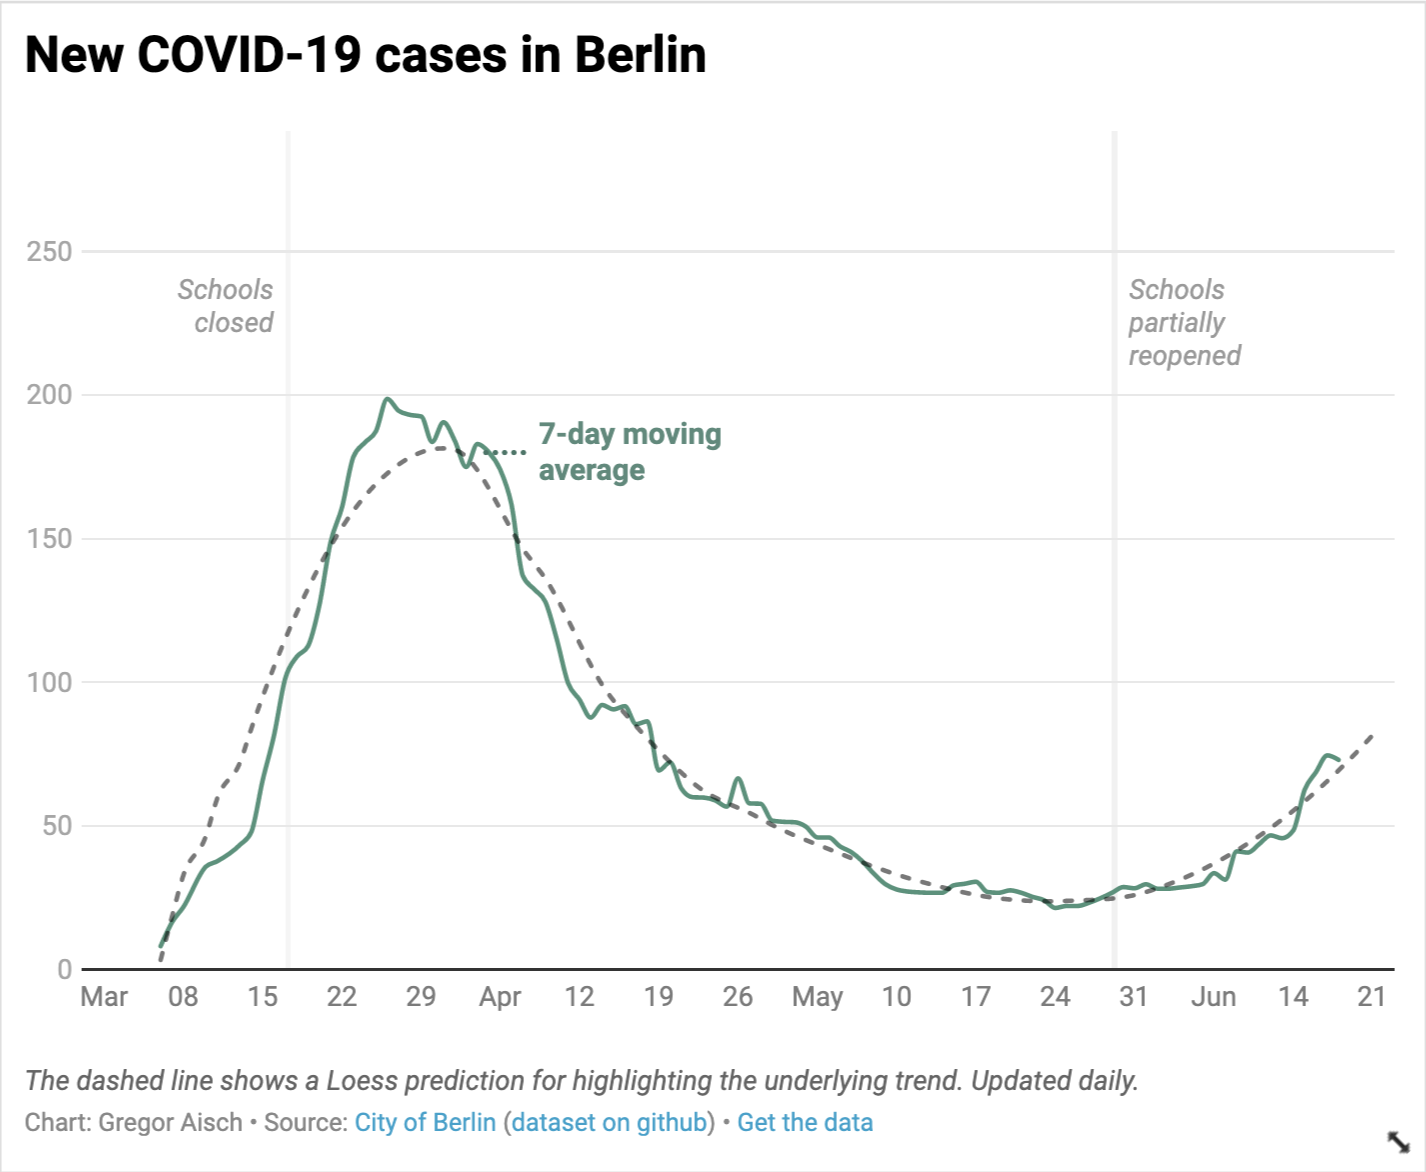
In this tutorial, we'll explain, step by step, how to create a chart that combines lines, columns, and dots. [1] You'll be able to do so with the line chart as the chart type. We'll take the following chart as an example:
This chart shows the 7-day rolling average of COVID-19 cases in Berlin which you can read more about in this Weekly Chart blog post "The COVID-19 chart I wish I didn’t have to make". (Hover over the chart and click on "Edit this chart" in the top right corner to duplicate the chart into your own chart editor.)
While the 7-day moving average (green line) and the Loess trend (dashed line) are shown in curved lines, COVID-19 cases per day (light green bars) and deaths per day (purple) are both shown in bars.
These bars are created by custom area fill feature, but more on this later.
- 1
- Let's start by taking a look at the dataset. Here's the dataset you'll upload to Datawrapper:
-
Notes: If you're not familiar with how to upload your data, read "How to upload data to Datawrapper". This example chart uses external data to automatically update the data from this CSV file. You can also look at the R code used for calculating the 7-day average and Loess prediction.


- 2
-
Check that the column types are set to dates and numbers in step 2.


- 3
-
In step 3: Visualize, choose "Lines" as your chart type. This should give you a line chart that looks like this.


- 4
-
Let's start customizing the lines. Under the Refine tab, go to the panel that says "Customize lines":
- 5
-
Right now, Datawrapper shows us all five columns as lines. But we only want to show the " 7-day average" and the "Loess prediction" as lines and the rest as columns. Let's start by customizing the two lines you want to show.
First, you can give some specific colors to the two lines you want to show. You can do this by clicking on the button " customize colors...":


- 5
-
Then for those you don't want to appear as lines but as bars - " Cases", "Deaths" - you can make them transparent by adding two zeros '00' at the end of its color hex code:

The last two digits of the hex code represent the alpha transparency. If you put 50, it sets the transparency to 50%. If you put 00, it makes it completely transparent, no matter what color it is. Making it transparent will not show the line, but will still show tooltips when you hover over the bars:


- 6
-
Now, let's change the style of the lines too. Let's change the " Loess prediction" to a dashed line. Do so by clicking on the line icons marked inside the box below.
We also want to show the lines as a curved interpolation. You can select this with the dropdown menu:

Once that's done, your chart should look like this:


- 7
-
Now, it's time for the area fills. Create an area fill between " (zero baseline)" and the two lines "Cases" and "Deaths" and give them each a color:

-
And then, set an interpolation by clicking on the interpolation icon:
-


- 8
-
And voila, you've now created a line chart with columns! As you can see, in the chart below we added some annotations to explain it. To learn how to create them yourself, visit the academy article " How to create text annotations".
How about combining a line chart with dots?
Here is another example of a chart showing a rolling average of daily COVID-19 cases, but for the US. This is a combination of a line and dots:
To create the chart above, go to step 3: Visualize.
In the Customize lines panel, set the "daily confirmed" to 0px:

Then in the Customize symbols panel, select Line symbols. Choose " multiple" as the shape.
Click on the little icon next to "daily confirmed" to choose circle as the symbol shape, and select "every point". This will allow you to plot the values not as lines but as dots like on a scatterplot.

In this article, you learned how to bring columns and dots into your line charts. For more examples of line charts, you can create using Datawrapper, visit " Examples of Datawrapper line charts".
[1] Datawrapper does not support a chart type that is specifically designed to combine line chart and column chart like the image below:

This is because, a lot of the times these combined charts require dual-axes - and we believe that charts with two different y-axes make it hard for most people to intuitively make right statements about two data series. For more on this topic, read "Why not to use two axes, and what to use instead".