How to embed visualizations in PowerPoint presentations
 Datawrapper is a tool used by many finance organizations, newsrooms, nonprofits, NGO’s, government organizations and others to create beautiful, responsive charts, maps, and tables. You can embed Datawrapper visualizations in your PowerPoint presentations with a free, official Datawrapper add-in that we built and maintain.
Download it here from the Microsoft app store.
It works in PowerPoint for Windows, Mac, and online.
With this add-in, you can add static Datawrapper visualizations from your Archive to your slides, and create and edit new visualizations directly in PowerPoint. This article explains how, and answers questions you might have.
How to download the add-in
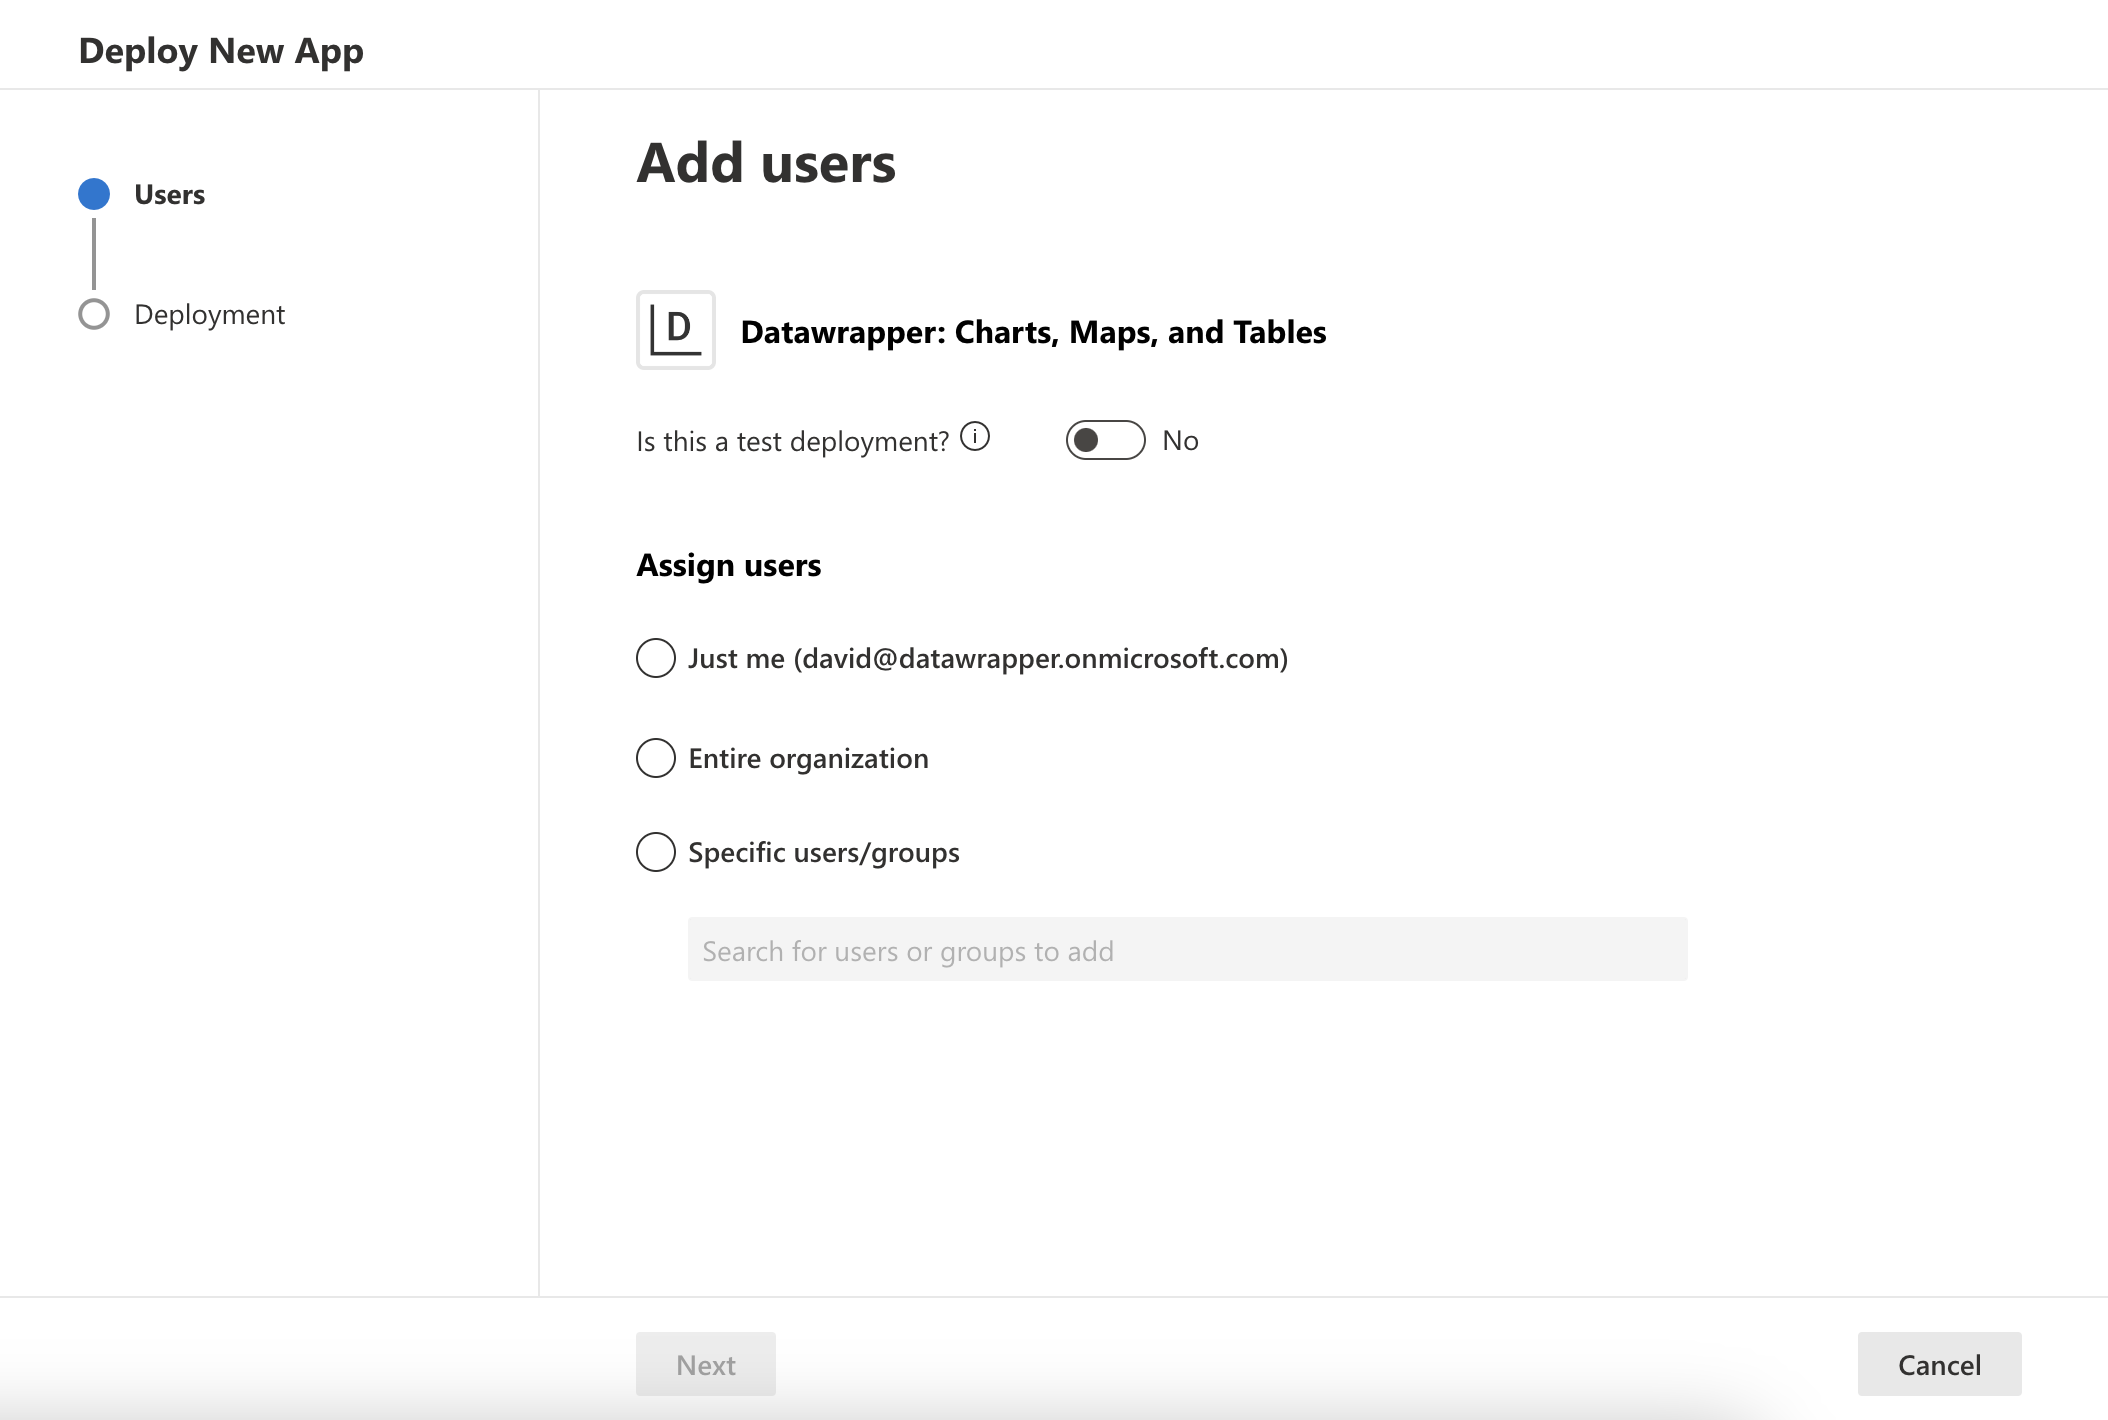
To add the Datawrapper add-in to PowerPoint, you can either click here and then on Get it now, or open PowerPoint, and then click on Insert > Add-ins > Get Add-ins and search for Datawrapper. Make sure to add the Datawrapper: Charts, Maps, and Tables add-in.
Once you installed it, you’ll see a new tab Datawrapper added to your PowerPoint ribbon. Click on it to see the available options: We recommend to click on Open Pane for an overview of all your added visualizations, and to edit them:
 To use the options in the menu and pane, you need a Datawrapper account. Sign up here.
How to add visualizations from the Datawrapper Archive to a slide
If you already created visualizations in Datawrapper, you can add them to your slides easily. To do so, click on Add from Archive in either the menu or the pane. This opens the Datawrapper Archive that you’re used to, with all your visualizations:

You can select one or multiple visualizations by dragging your mouse over them or by using shortcuts (Shift/Cmd).
Once you’re happy with your selection, click on Choose visualization, and it will appear on your slide.
- To position it, drag it around.
- To resize it, grab one of the anchors on the corners or sides and drag it until you’re happy.

How to create a Datawrapper visualization within PowerPoint
To create a chart, map, or table that automatically gets embedded in your PowerPoint slide, click on Create new in either the Datawrapper tab or the pane. You can choose if you want to create a chart, map, or table:

👉 If you use the Create new… button in the pane and hover over the bottom of the menu that opens, you’ll be able to select the team in which you want to create the new visualization.
Once you click on Create new, a window opens, in which you can upload your data and visualize it as you’re used to from Datawrapper. Whenever you click on Done in the lower right, the visualization will be embedded on the slide you’re currently on. You can always resume editing.
 If you’re new to Datawrapper, you can learn about it on our website or in our Welcome section. A good starting point is the article How to create your first Datawrapper chart.
How to edit a Datawrapper visualization within PowerPoint
There are two ways to edit a Datawrapper visualizations you already embedded.
To open the full Datawrapper editing experience, select a visualization on a slide or in the pane, then click on Edit visualization in the Datawrapper menu or in the settings at the bottom of the pane. This will open a window in which you can edit your visualziation, as shown above. To bring the edits in your embedded visualization, simply click Done in the lower right.

The second option is to make adjustments to a visualization you selected in a pane directly in the settings at the bottom of the pane:

These are the available options:
- Padding: Adds a border around your visualization that has the same color as its background.
- Scale factor: Makes the contents of the chart (e.g. fonts, grid, data symbols) larger or smaller. This is a great way to make your chart easier to read while still taking up the same amount of space.
- Dark mode: Gives your chart a dark background and adjusts the color of all other chart elements. Learn more about dark mode here.
- Transparent background: Takes away the background color of your visualization, so that all underlying objects shine through. This can be a good way to integrate your chart or map more with your slide background.
- Title and description: Changes the chart headline and the description below it. Learn more about title and description here.
👉 If you’re changing any of these options and the Designer pane is open, too, PowerPoint might switch to that pane to “generate design ideas”. You can disable that by going to PowerPoint → Preferences → General, and then uncheck “Automatically show me design ideas”.
FAQ
Why should I use this add-in instead of exported PNGs or screenshots of my visualizations?
There are a few big advantages to using the add-in over images:
- A faster workflow: When using PNGs or screenshots and you want to make changes in design, you need to open your charting tool, make the changes there, export a new PNG (or take a new screenshot) and then replace the image in your presentation. With the Datawrapper add-in, you just click “edit this visualization”, make your changes, click “done”, and the chart updates automatically. You can stay in PowerPoint, and you don’t need to export your visualization again.
- Automatic responsive resizing: If you decide that your chart should be wider or narrower than expected, you can simply resize it in PowerPoint, and Datawrapper will automatically adjusts the design for you (e.g. by showing more or fewer axis labels and adjusting the font).
- An overview of all the visualizations you have embedded in your slides is available in the add-in pane, including the slide numbers and thumbnails.
My organization's security policies don't allow me to access the Microsoft app store to download the add-in. What can I do?
That way, access can be limited to the people in your organization that need it.
Can I change the theme (fonts, logo, colors) of my visualizations?
Yes. As part of a Custom or Enterprise plan, you get a custom theme in which you can define the fonts, colors, or extra elements like logos for all visualizations you and your team member publish.
Can my embedded visualizations show live-updating data?
Mostly. Datawrapper offers many options for live-updating charts, maps, and tables. In PowerPoint, you can always update the visualizations on your slides to show the latest data (and design) by clicking on Update visualizations in the Datawrapper tab.
However, this is not a background process: Visualizations whose data changes every second or so won't automatically show the most recent data.
Why can I only embed static visualizations with this add-in?
Static visualizations come with a lot of advantages that you will benefit from:
- The visualizations on your slides will be visible when you’re offline, have a bad internet connection, or working on an air-gapped computer.
- Visualizations can be embedded without being published, which is great for confidential data. You also don’t need to republish visualizations when making changes to them – they will show up in PowerPoint immediately.
- Embedded visualizations are visible to everyone who opens your PowerPoint file, even if they have not installed the Datawrapper add-in.
- Embedded visualizations load instantly when you’re presenting.
- The title, description, padding, scale factor, dark mode, and transparent background can be edited directly in PowerPoint.
- And: Embedded visualizations look sharp in PDF export.
Because static visualizations have so many benefits and because we believe that for most presentations, they’re sufficient, the add-in only lets you embed them for now.
How can I embed interactive visualizations?
Embedding static images offers advantages over embedding interactive visualizations, as you can see in the answer to the FAQ question above. But some presentations are simply better with interactive visualizations – to zoom into maps, or to see tooltips when hovering over data points. To embed interactive Datawrapper visualizations, you can use our additional Datawrapper Visualization add-in. Find an explanation of it here.